Stop Copy–Pasting. Start Iterating.
Making a loop (when and how to do it properly)
After fixing structure (N.3), adding sanity checks (N.5), and reshaping data properly (N.6), the next natural step is iteration over clean data.
In R, the problem is rarely how to write a loop. The real question is:
When should you loop — and when should you not?
This R-Hack focuses on replacing duplication with controlled iteration.
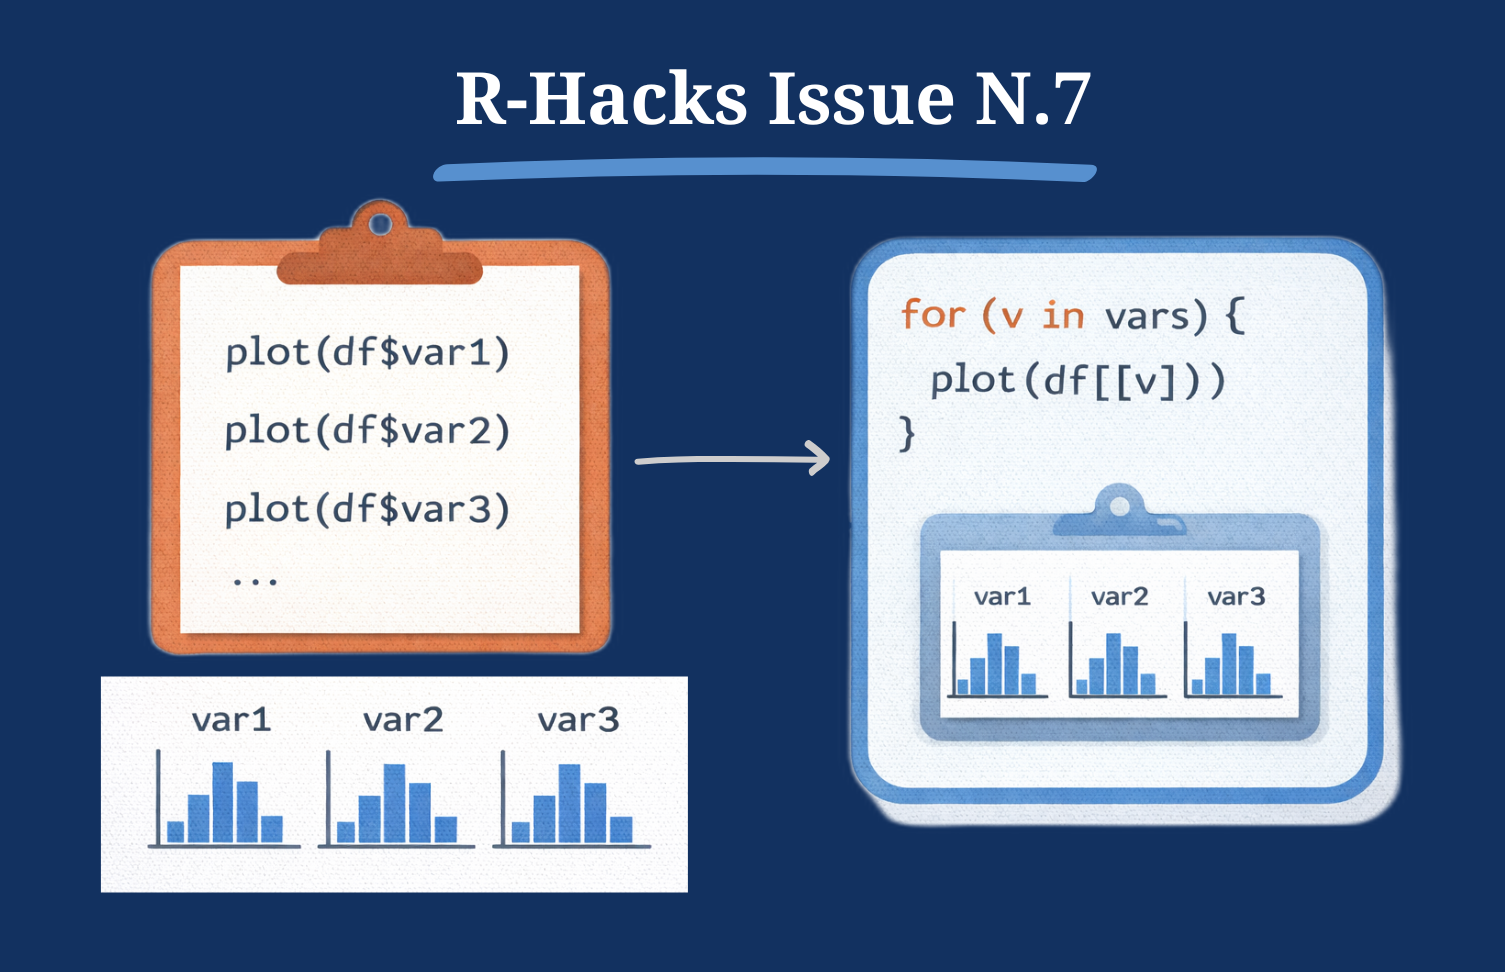
The Core Problem: Duplication
You see code like this:
Or:
It works.
- But it does not scale
- It is fragile
- And it invites mistakes
Duplication is your signal that iteration may be appropriate.
Step 1 – Simulate Example Data
         var1     var2     var3
1 -0.56047565 1.289593 6.198810
2 -0.23017749 2.256884 5.312413
3  1.55870831 1.753308 3.734855
4  0.07050839 1.652457 4.543194
5  0.12928774 1.048381 3.585660
6  1.71506499 1.954972 3.523753
Step 2 – A Clean for Loop
Instead of repeating logic, define the variables once.
[1] 0.09040591
[1] 1.892453
[1] 4.120465
This loop:
- iterates over column names
- extracts values using [[ ]]
- avoids copy–paste
- keeps logic consistent
Simple and readable.
Step 3 – Storing Results Properly (Preallocation)
If you need results for later use, preallocate.
[1] 0.09040591 1.89245320 4.12046511Why preallocate?
- avoids growing objects inside the loop
- keeps structure explicit
- improves clarity and performance
Preallocation is not about micro-optimisation. It is about good structure.
Step 4 – Plotting Without Copy–Paste
❌ The Copy–Paste Pattern
This works — but does not scale.
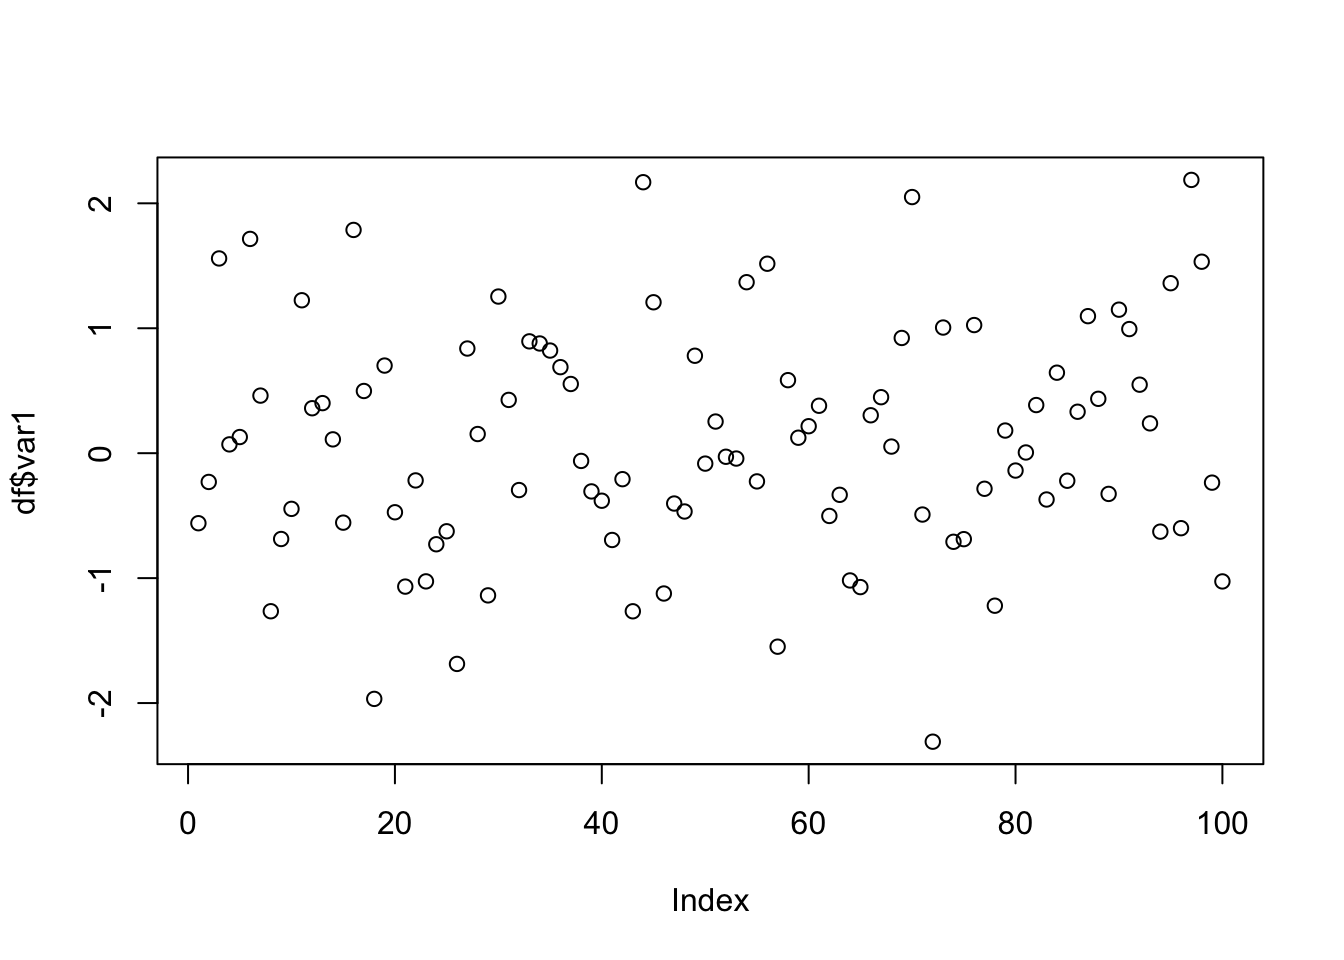
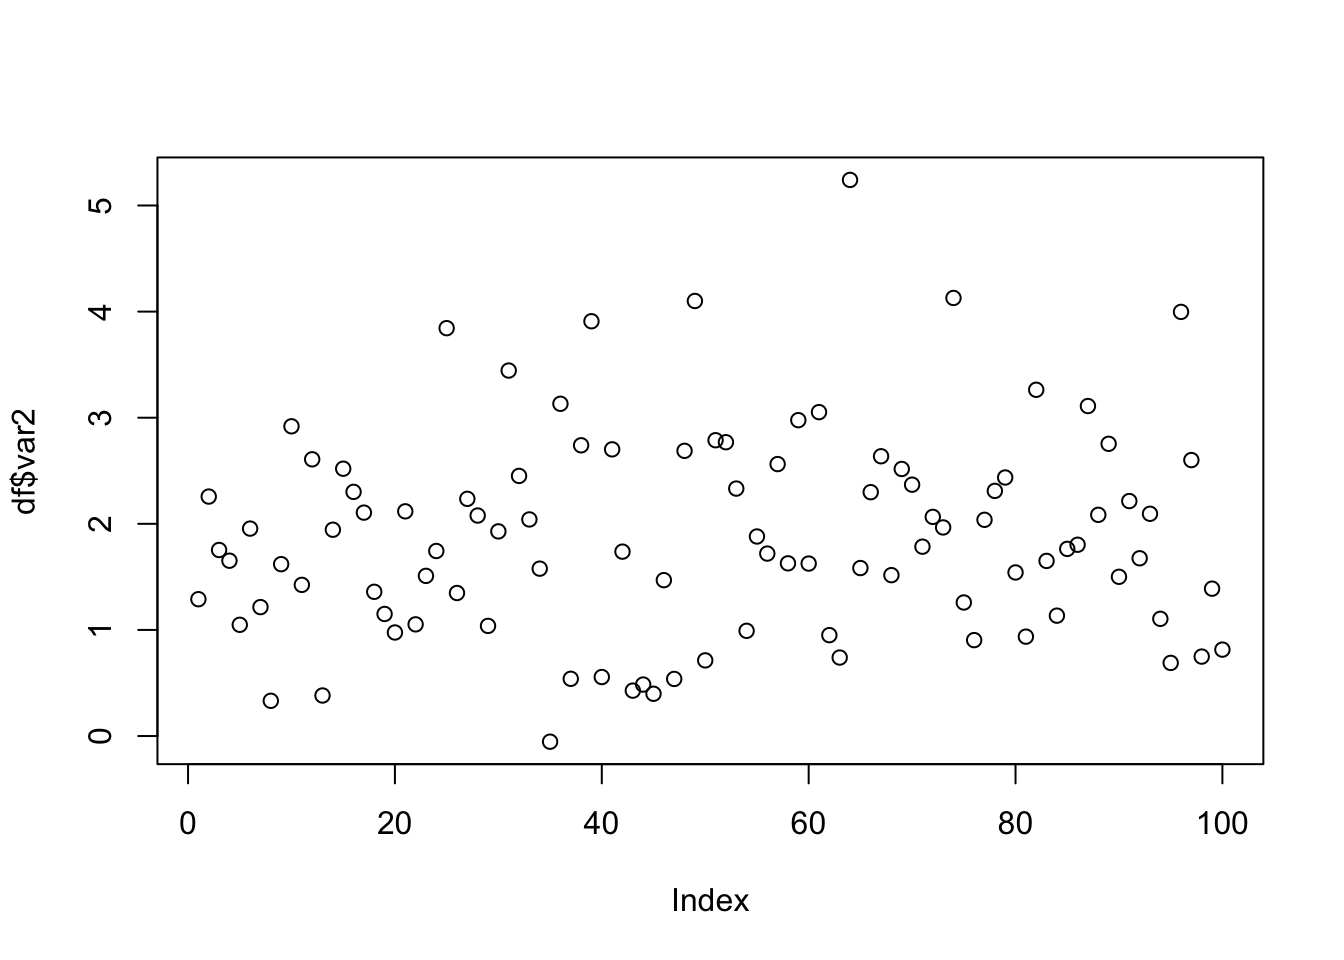
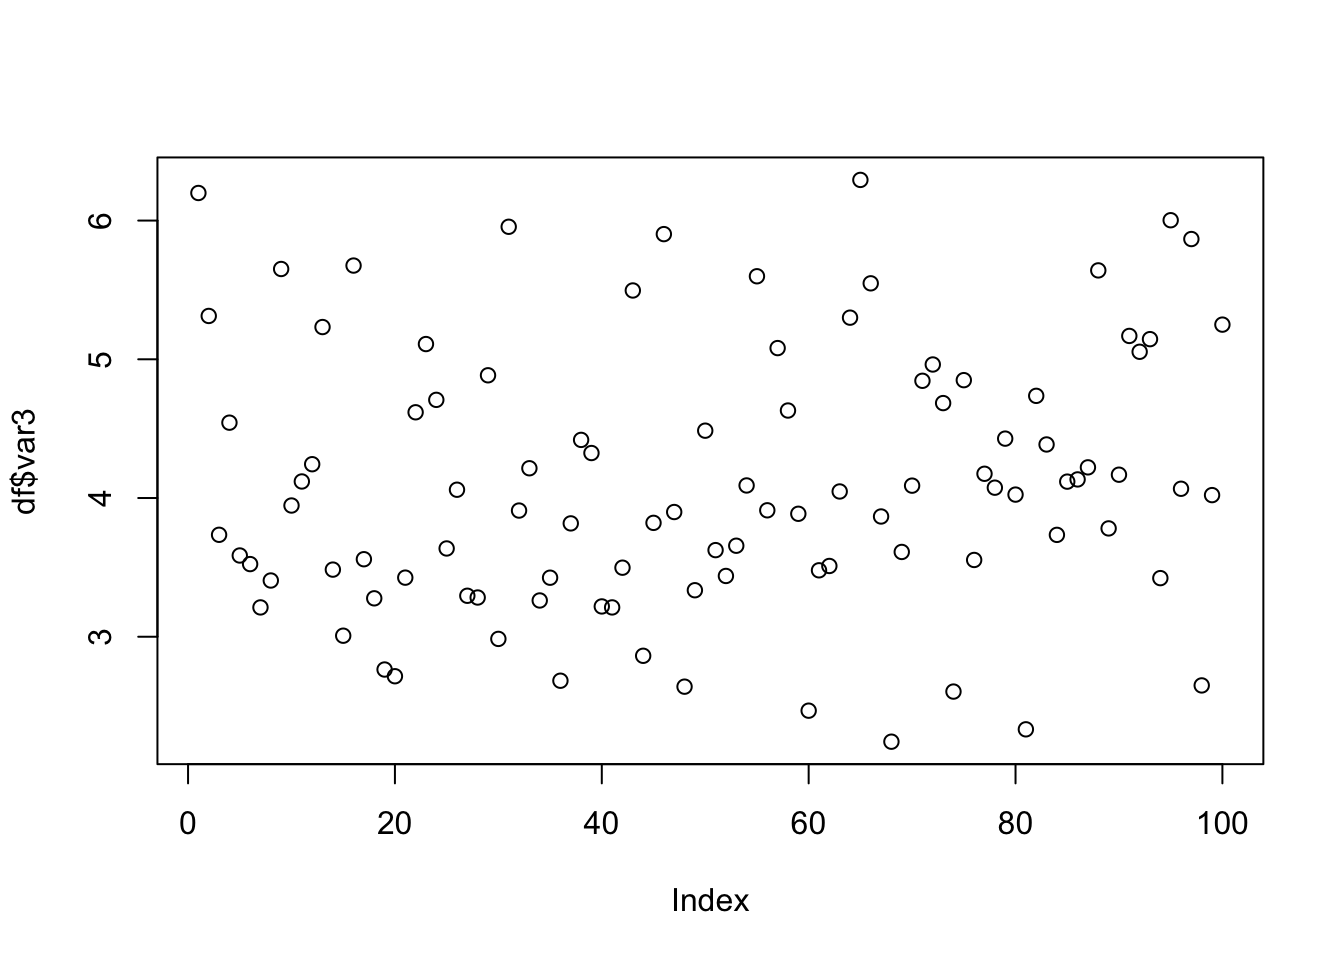
✅ Base R Loop
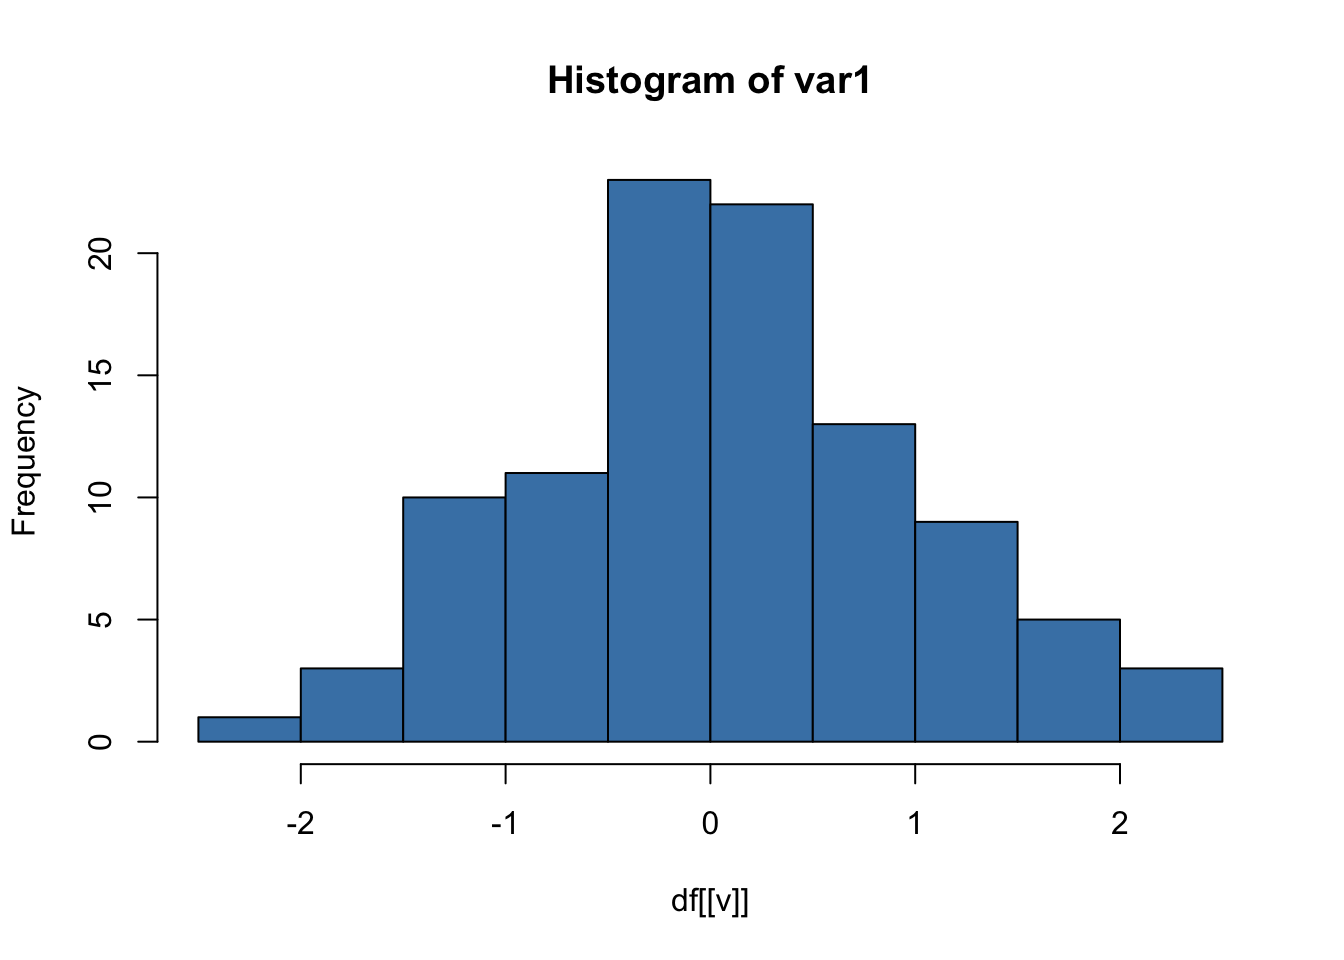
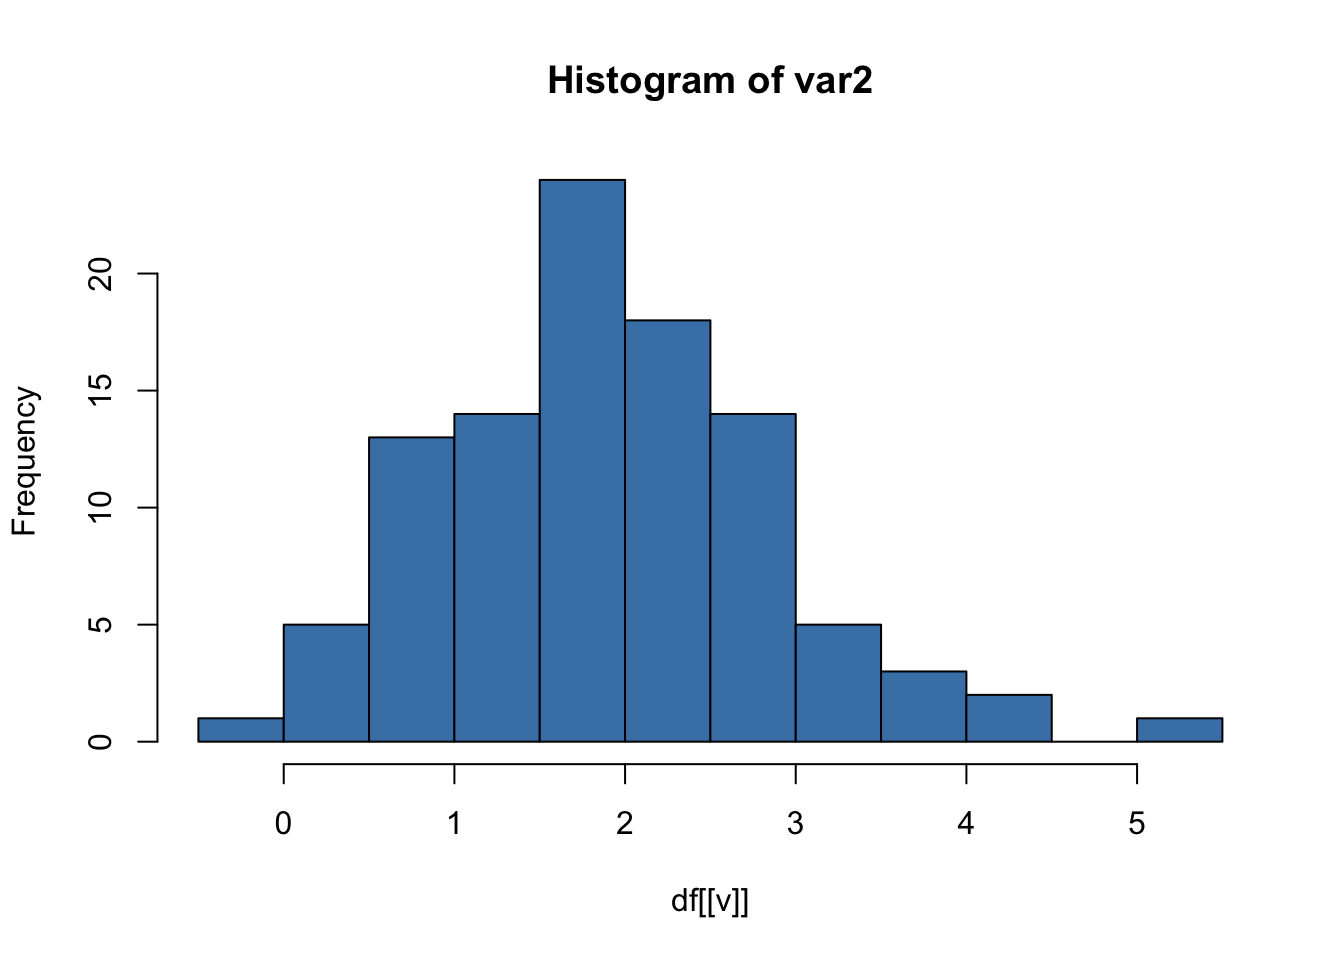
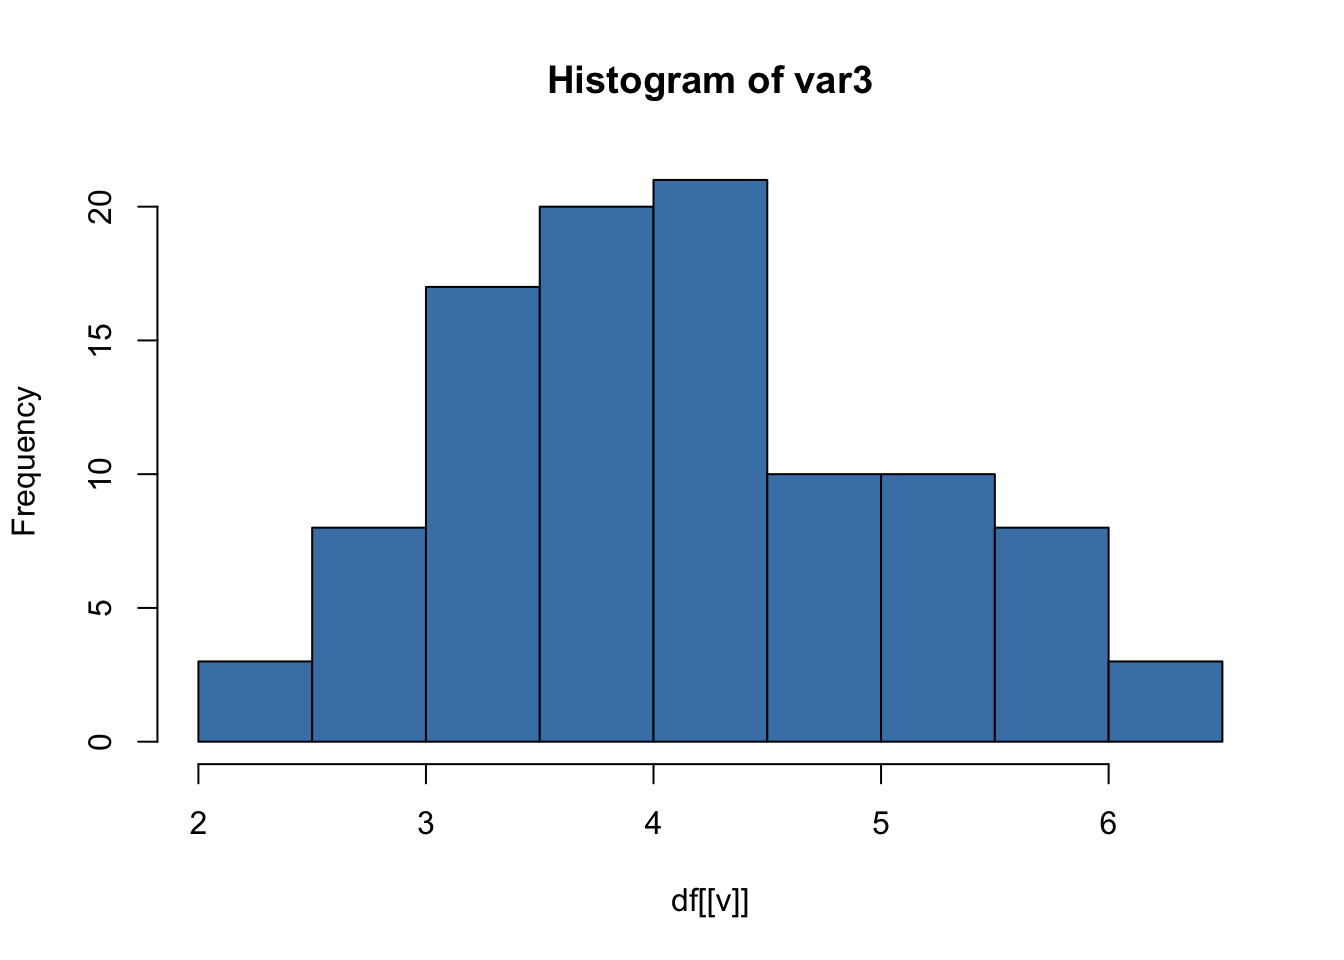
This produces one histogram per variable.
✅ ggplot2 Loop (Important Detail)
library(ggplot2)

for (v in vars) {
  p <- ggplot(df, aes(x = .data[[v]])) +
    geom_histogram(fill = "steelblue", bins = 20) +
    labs(title = paste("Histogram of", v)) +
    theme_minimal()

  print(p)
}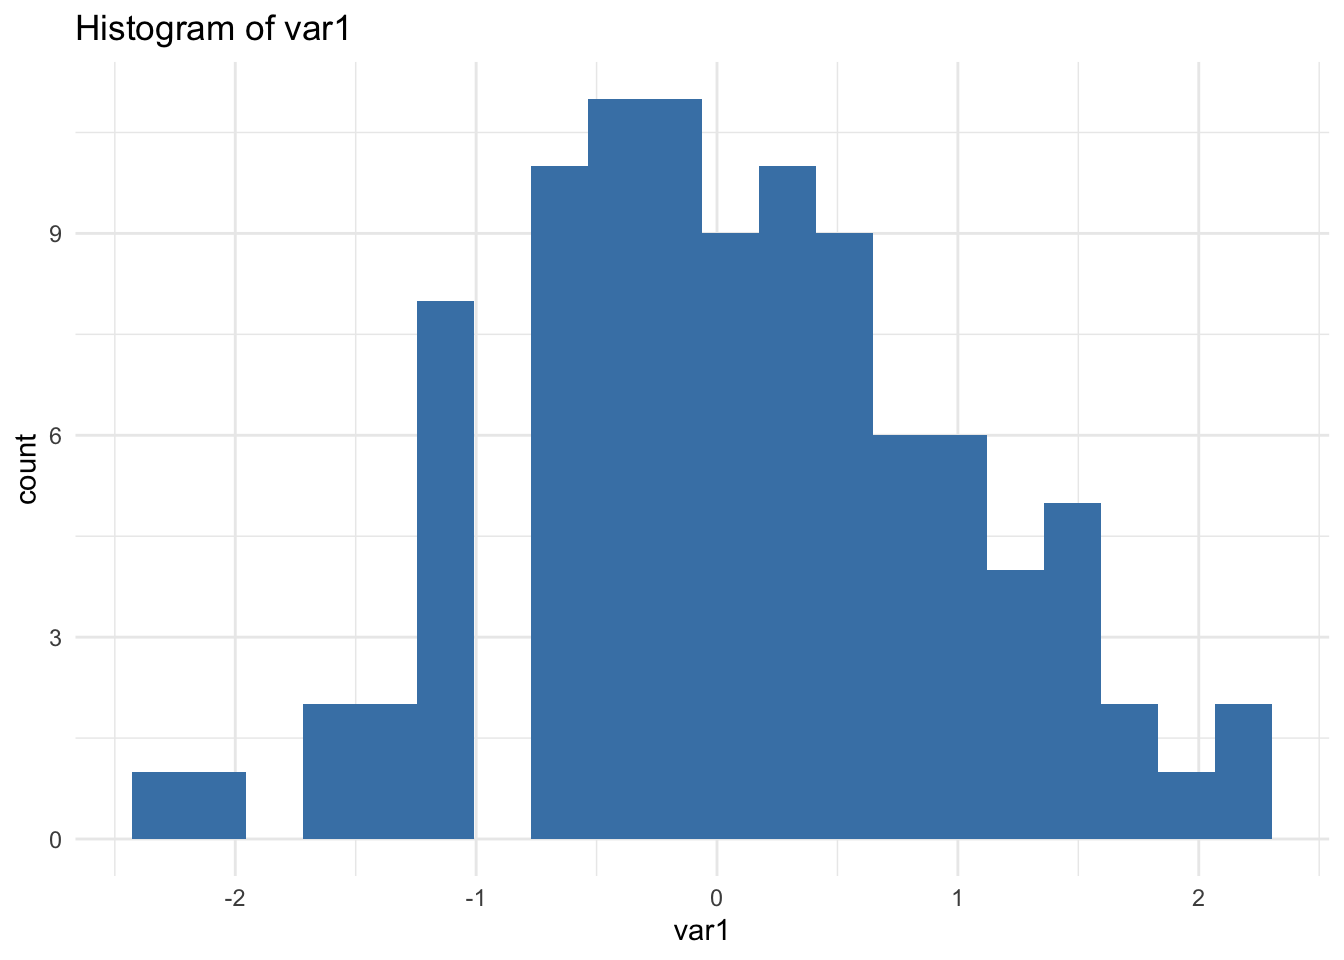
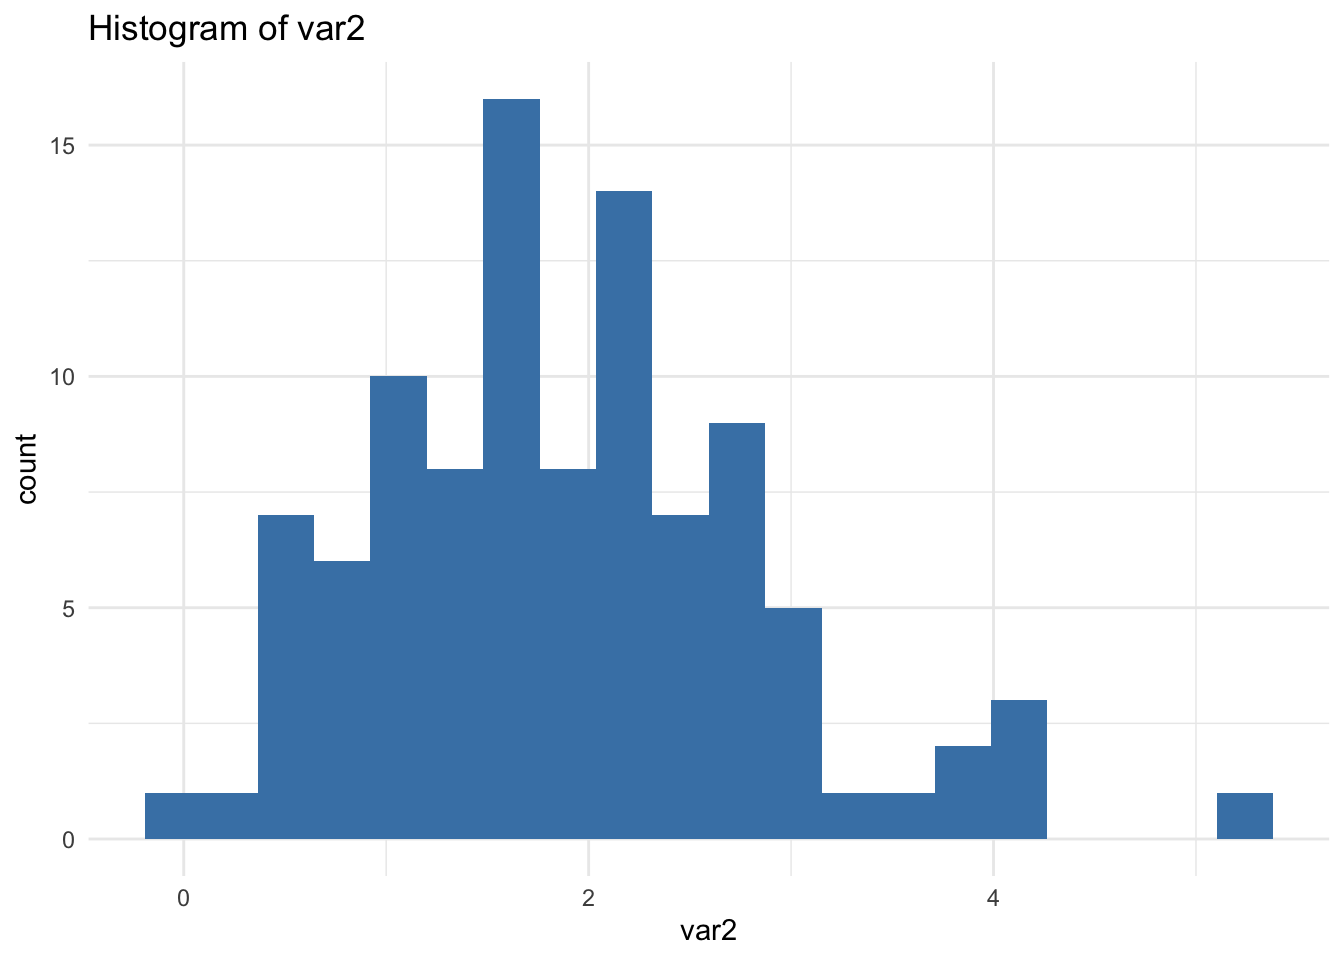
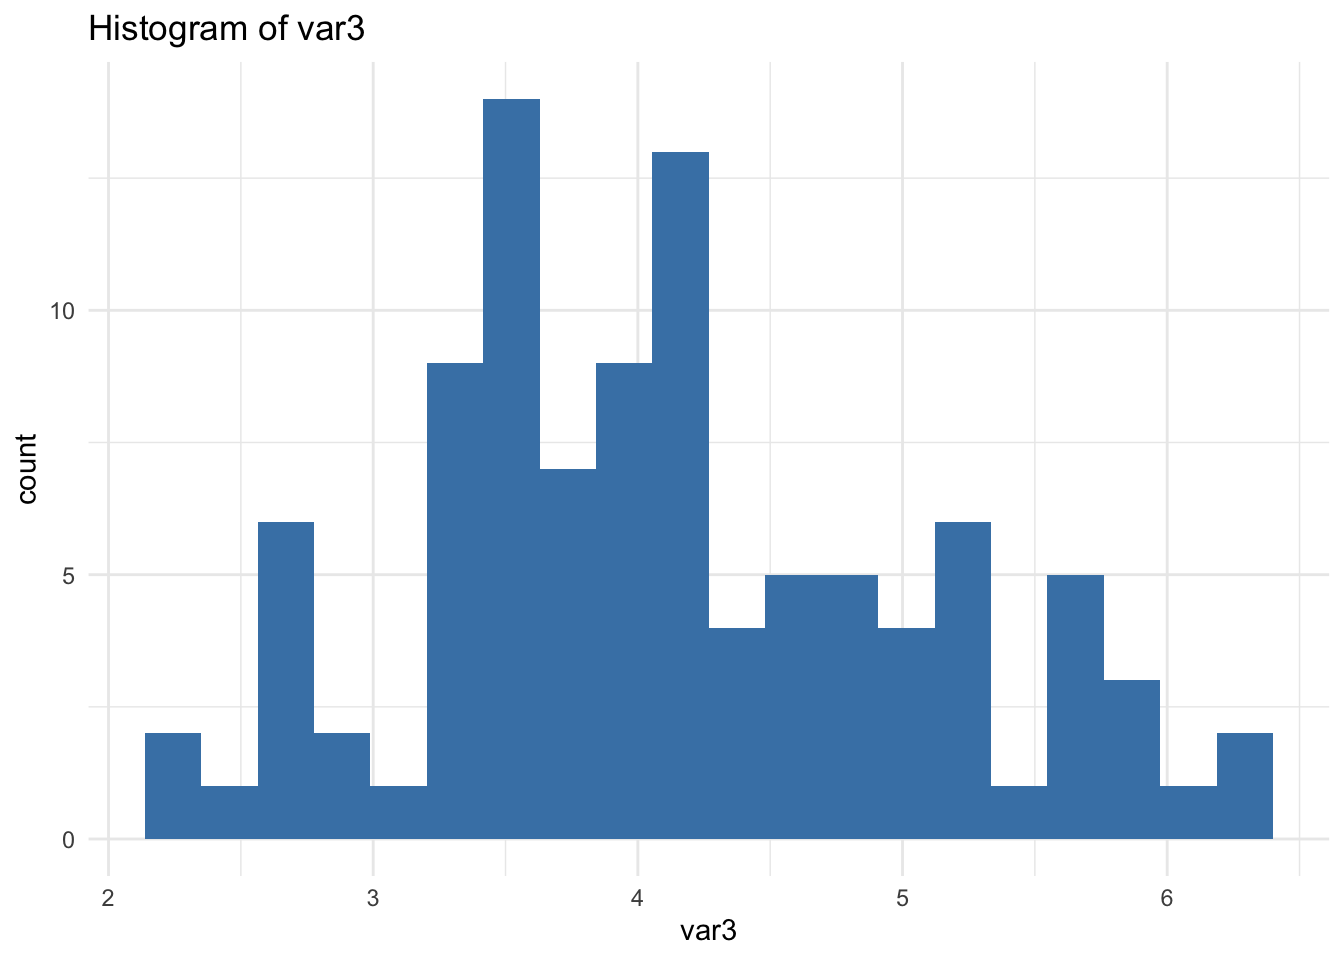
🔎 Important: print(p) is required inside loops. Without it, nothing is displayed.
This is a subtle but crucial detail many users miss.
When Not to Loop
If you are looping over columns, pause. Ask:
Should the data be long instead?
For example (see R-Hacks N.6):
library(tidyr)

df_long <- df |>
  pivot_longer(
    cols = everything(),
    names_to = "variable",
    values_to = "value"
  )

ggplot(df_long, aes(value)) +
  geom_histogram(bins = 20, fill = "steelblue") +
  facet_wrap(~ variable, scales = "free") +
  theme_minimal()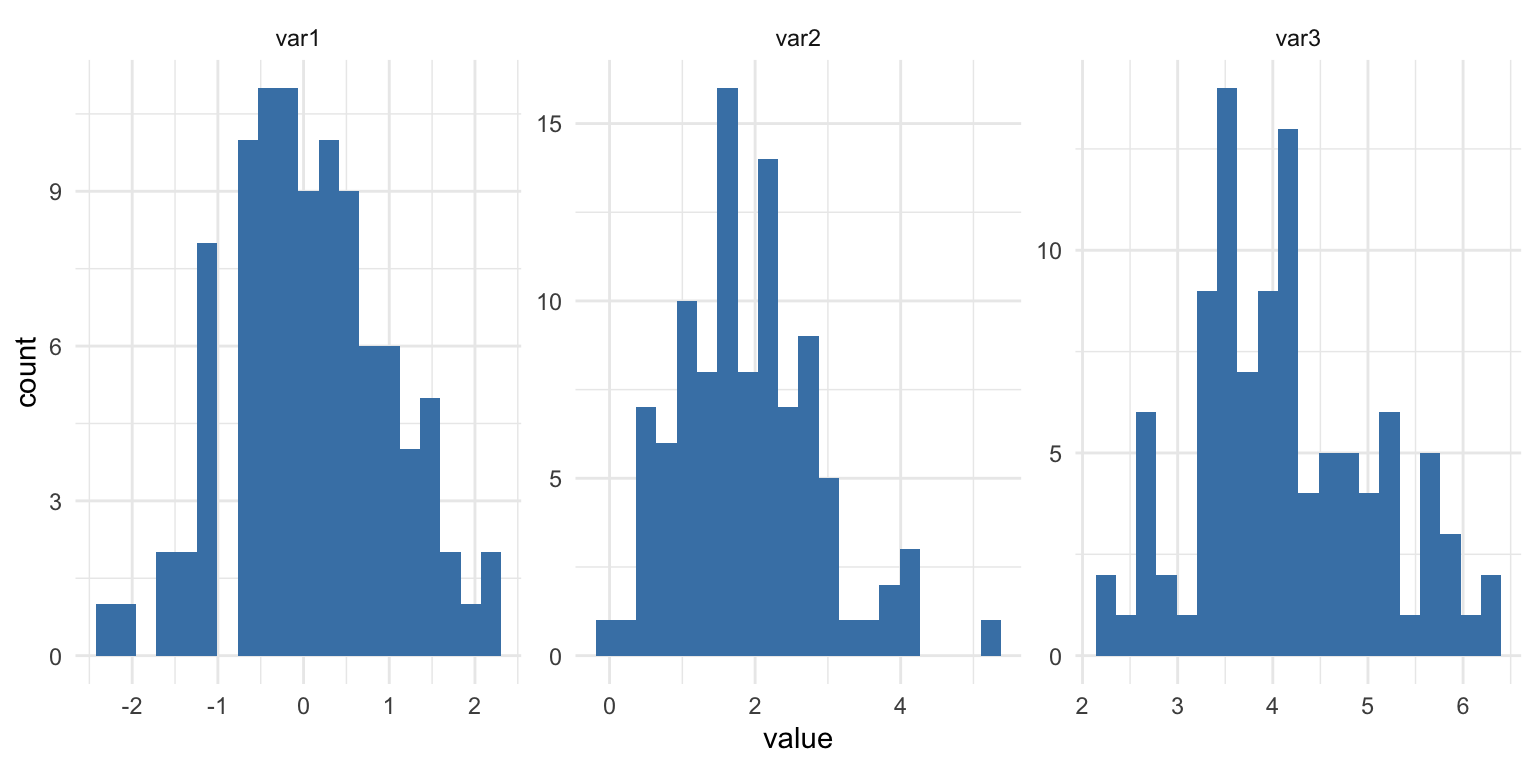
Sometimes reshaping simplifies everything more than iterating.
Editorial Stance
Loops are not bad. Copy–paste is worse.
The goal is not to write clever code. The goal is to write less duplicated code.
Iteration becomes powerful when:
- structure is clean
- shape is correct
- logic is stable
In Short
- Duplication is a signal
- Replace repetition with controlled iteration
- Preallocate when storing results
- Remember print() inside ggplot loops
- If you are looping across columns, reconsider the data shape
Iteration is not about complexity. It is about discipline.
If you want to stay up to date with the latest events and posts from the Rome R Users Group:
👉 https://www.meetup.com/rome-r-users-group/