mean(df$col)
df$col > 100
df$new_col <- df$col * 2What R Is Best For (And Why It Still Matters)
Understanding where R truly shines
workflows
analytics
positioning
R-Hacks N.9
The question is not:
“Is R better than Python?”
The better question is:
“What is R best for?”
Note
Every tool has strengths.
The value of R appears clearly when you focus on its design philosophy.
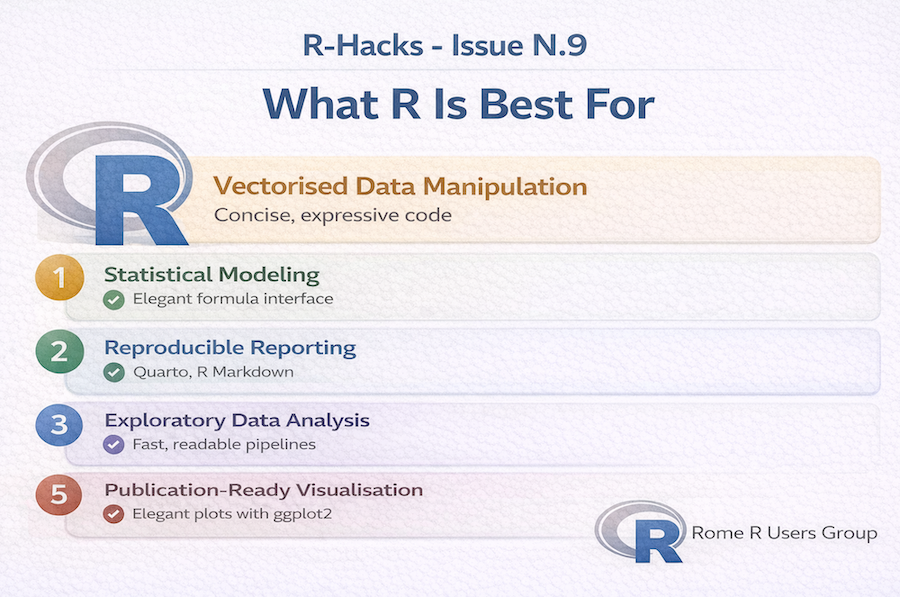
1️⃣ Vectorised Data Manipulation
In R, most operations are naturally vectorised.
No explicit loops required.
This makes analytical code:
- concise
- expressive
- readable
R was built for data first — not as a general-purpose programming language.
2️⃣ Statistical Modeling (Out of the Box)
R was designed for statistics.
Modeling syntax is natural:
Compare this to lower-level implementations elsewhere.
R’s formula interface is still one of the most elegant modeling abstractions available.
3️⃣ Reproducible Reporting
R integrates seamlessly with:
- Quarto
- R Markdown
- parameterised reports
- dynamic documents
You can move from:
Tip
data → model → visual → report
in one environment.
Few ecosystems make this as smooth.
4️⃣ Exploratory Data Analysis
R encourages rapid iteration:
df |>
  group_by(group) |>
  summarise(mean_value = mean(value))
The tidyverse philosophy makes analytical transformations readable and composable.
For exploratory statistics, this is powerful.
5️⃣ Publication-Ready Visualisation
ggplot2 remains one of the most coherent grammar-based plotting systems.
ggplot(df, aes(x, y)) +
  geom_point() +
  theme_minimal()
Layered, declarative, expressive.
6️⃣ Where R Is Not Always Best
R may not be the best choice for:
- large-scale production APIs
- full-stack applications
- system-level programming
And that’s fine.
Tools should be chosen by purpose, not ideology.
The Practical Conclusion
If your work is:
- statistical
- analytical
- exploratory
- report-driven
- reproducible
R is still one of the most efficient tools available.
Not because it replaces everything.
But because it was designed for analysis.
Note
In Short
- R excels at statistics and modeling
- R is expressive for analytical workflows
- R integrates naturally with reporting
- R remains extremely strong for EDA and visualisation
- Choose tools based on task, not trend
R does not need to compete with everything.
It just needs to do what it does best.
Tip
If you want to stay up to date with the latest events and posts from the Rome R Users Group: